Membrane Capacitance
This tutorial describes how to estimate membrane capacitance by integrating capacity currents in a voltage clamp experiment.
- Load the file model csevc.
This recording was made in continuous single-electrode voltage clamp (cSEVC) mode using the Axoclamp 2B amplifier and the Axon instruments model cell, while following the instructions in the Axon Axoclamp 2B manual to simulate a whole-cell patch. The labels on the model cell indicate that the membrane capacitance is 33 pF, the membrane resistance is 500 MOhms, while the access resistance is 10 MOhms.
The recording was initially made using the CED Signal programme with 32 frames of data, and subsequently copied as a native DataView file for tutorial purposes. Thus the start time of each frame (sweep) is marked with an event in channel a. Each sweep lasts 10 ms, and a 50 mV command step of 2.5 ms duration was applied 2 ms into each sweep. The top trace is the voltage clamp command voltage, the middle trace is the clamp current, and the bottom trace is the actual membrane potential (this latter would not be available in a real experiment, but can be measured directly in the model cell with a second electrode). There was no series resistance compensation, so the membrane potential response is not optimal.
Normally, in a voltage clamp experiment, the data of interest are the relatively slow currents reflecting the ion flow through voltage-dependent ion channels. However, in all voltage clamp experiments there is an early transient current called the capacity (or capacitative) current. This current, as the name suggests, is the current that flows into the membrane capacitance during the immediate onset of the voltage command step which is necessary to change the membrane voltage to its new value. Thus the charge that flows during the capacity current is directly proportional to the membrane capacitance. Charge is the integral of current and time: Q = It, where Q is charge in Coulombs, I is current in amps, and t is time in seconds, so integrating the area under the current trace, down to the level of the steady state leakage current, should give us a value proportional to the membrane capacitance. Since membrane capacitance is directly proportional to membrane surface area, this technique has been used to demonstrate the increase in surface area consequent on vesicle fusion during exocytosis, and also the presence of gap junctions between cells.
- Select the Event analyse: Integrate re events command to activate the Integrate Values in Events dialog box.
- Leave the Event channel at a.
- Set the Trace to 2 to show the current trace.
- 32 sweeps of data were recorded, and they all have exactly the same timing relative to the start of the sweep, so we can set the Count to average to 32, to reduce the noise on the current trace. The grey traces show the individual records (confirming that they superimpose correctly), while the red trace shows the average value of the current trace.
- Set the Display Start to 1.5 ms, and the Dur to 4 ms to zoom in the display to the relevant section.
- Set the Integ Start to 0.5, and the Integ Dur to 2.4 ms.
You could also drag the blue cursors. - Click the increase gain button (
 ) in the dialog toolbar four times, so that you can see the level of the baseline leakage current more clearly.
 - Set the baseline to 0.1, so that the green cursor is positioned at the level of the leakage current.
You could also drag the green cursor.
We have now set up the conditions correctly.
- Click the Integrate button.
There are three integration values calculated. The top (.bin) gives the raw integral; i.e. the sum of the data values in each bin between the cursors, with the baseline subtracted from each bin. The second (.msec) scales the integral into millsecond units, the third (.sec) scales it into seconds units.
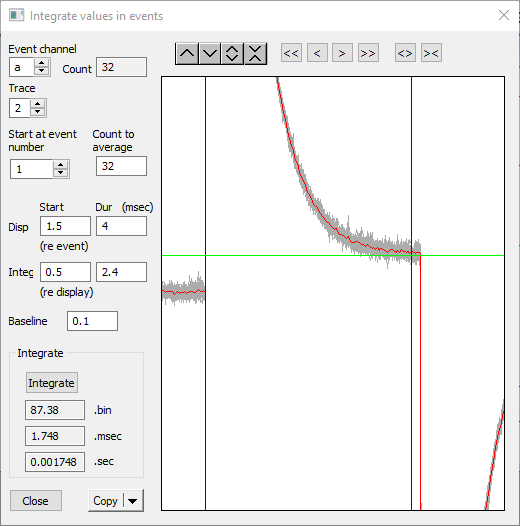
The .sec parameter now reads 0.001748, or thereabouts. The current trace is scaled to display in nA, and the integral thus displays in nA.sec, which is n(ano)C(oulombs). The dialog box should look like this:

The equation relating charge, capacitance and voltage is Q = CV, where Q is charge in Coulombs, C is capacitance in Farads, and V is voltage in volts. So
\[C=\frac{0.001748\times10^{-9}}{50\times10^{-3}}=34.9\; \mathsf{pF}\]
(The denominator of 50 mV is the step size of the voltage clamp.) The label on the model cell supplied by Axon Instruments states that the cell capacitance is in fact 33 pF, so the measurement has been made with reasonable accuracy. The leakage current of 0.1 nA also fits with the command step of 50 mV and the nominal membrane resistance of 500 MOhm.